Amtrak Performance Profile
The Amtrak Performance Profile is a comprehensive data-driven project which aims to collect, parse, save, and display real-time and historical performance data of Amtrak trains across its vast network. This project leverages Amtrak’s Realtime datafeed and GTFS (General Transit Feed Specification) Static data, to provide insights into train punctuality, route efficiency, and overall service quality. A PostgreSQL database is used to store and manage collected data, visualized through an Angular website.
The project is published here: amtrak.nathanskelton.me
Why
I created this project with the aim of developing a tool to discover insights into the performance of Amtrak’s trains, empowering data-driven decisions that could improve service. It’s a lofty ambition for a project not sponsored, or even directed by Amtrak. But with that purpose in mind, this is what I made.
Realistically, this project enables passengers to access information about train performance, leading to better planning regarding Amtrak’s service. And, its a fun set of data to look at.
Features
-
Data Collection: The project has an automated data collection process that fetches real-time information from Amtrak’s Realtime API, which provides updates on train position, speed, and other relevant metrics. Additionally, the system periodically updates its database with GTFS Static data, including schedules and route definition information.
-
Data Parsing and Storage: Collected data is parsed, cleaned, and stored in a PostgreSQL database. Real-time data is continually added, developing a historical dataset for analysis and reporting.
-
Interactive Dashboard: Users access a mobile-friendly, web-based dashboard to explore train performance metrics visually. The dashboard features interactive graphs, charts, and maps that allow users to filter and compare data by station, route, and time period.
Implementation

There are two regular processes for this project.
The first is the data collection process. On a regular basis, GTFS realtime data is queried for new information on active trains. This data is appended to existing trains, creating nesessary rows for any station updates and position updates. New trains are identified and created as necessary. Any unrecognized stations or train routes in this process will trigger a referesh of the locally stored static information from the GTFS static source. Otherwise, static information is refereshed upon any restart of the collection process.
The second process is one of static API response generation. Functionally, this process caches data for a fixed period for users. This runs perodically to commit new data to the hosted git repo, which triggeres a project rebuild through the hosting provider. The data observed on the website is static “cached” files. As a result, the UI can be hosted in “live” mode to debug and test against realtime data, while hosted for production without exposing an API to the world.
This project would not be possible without the GTFS specifications, and hosted data sources like asm.transitdocs.com. To those resources, I say thank you.
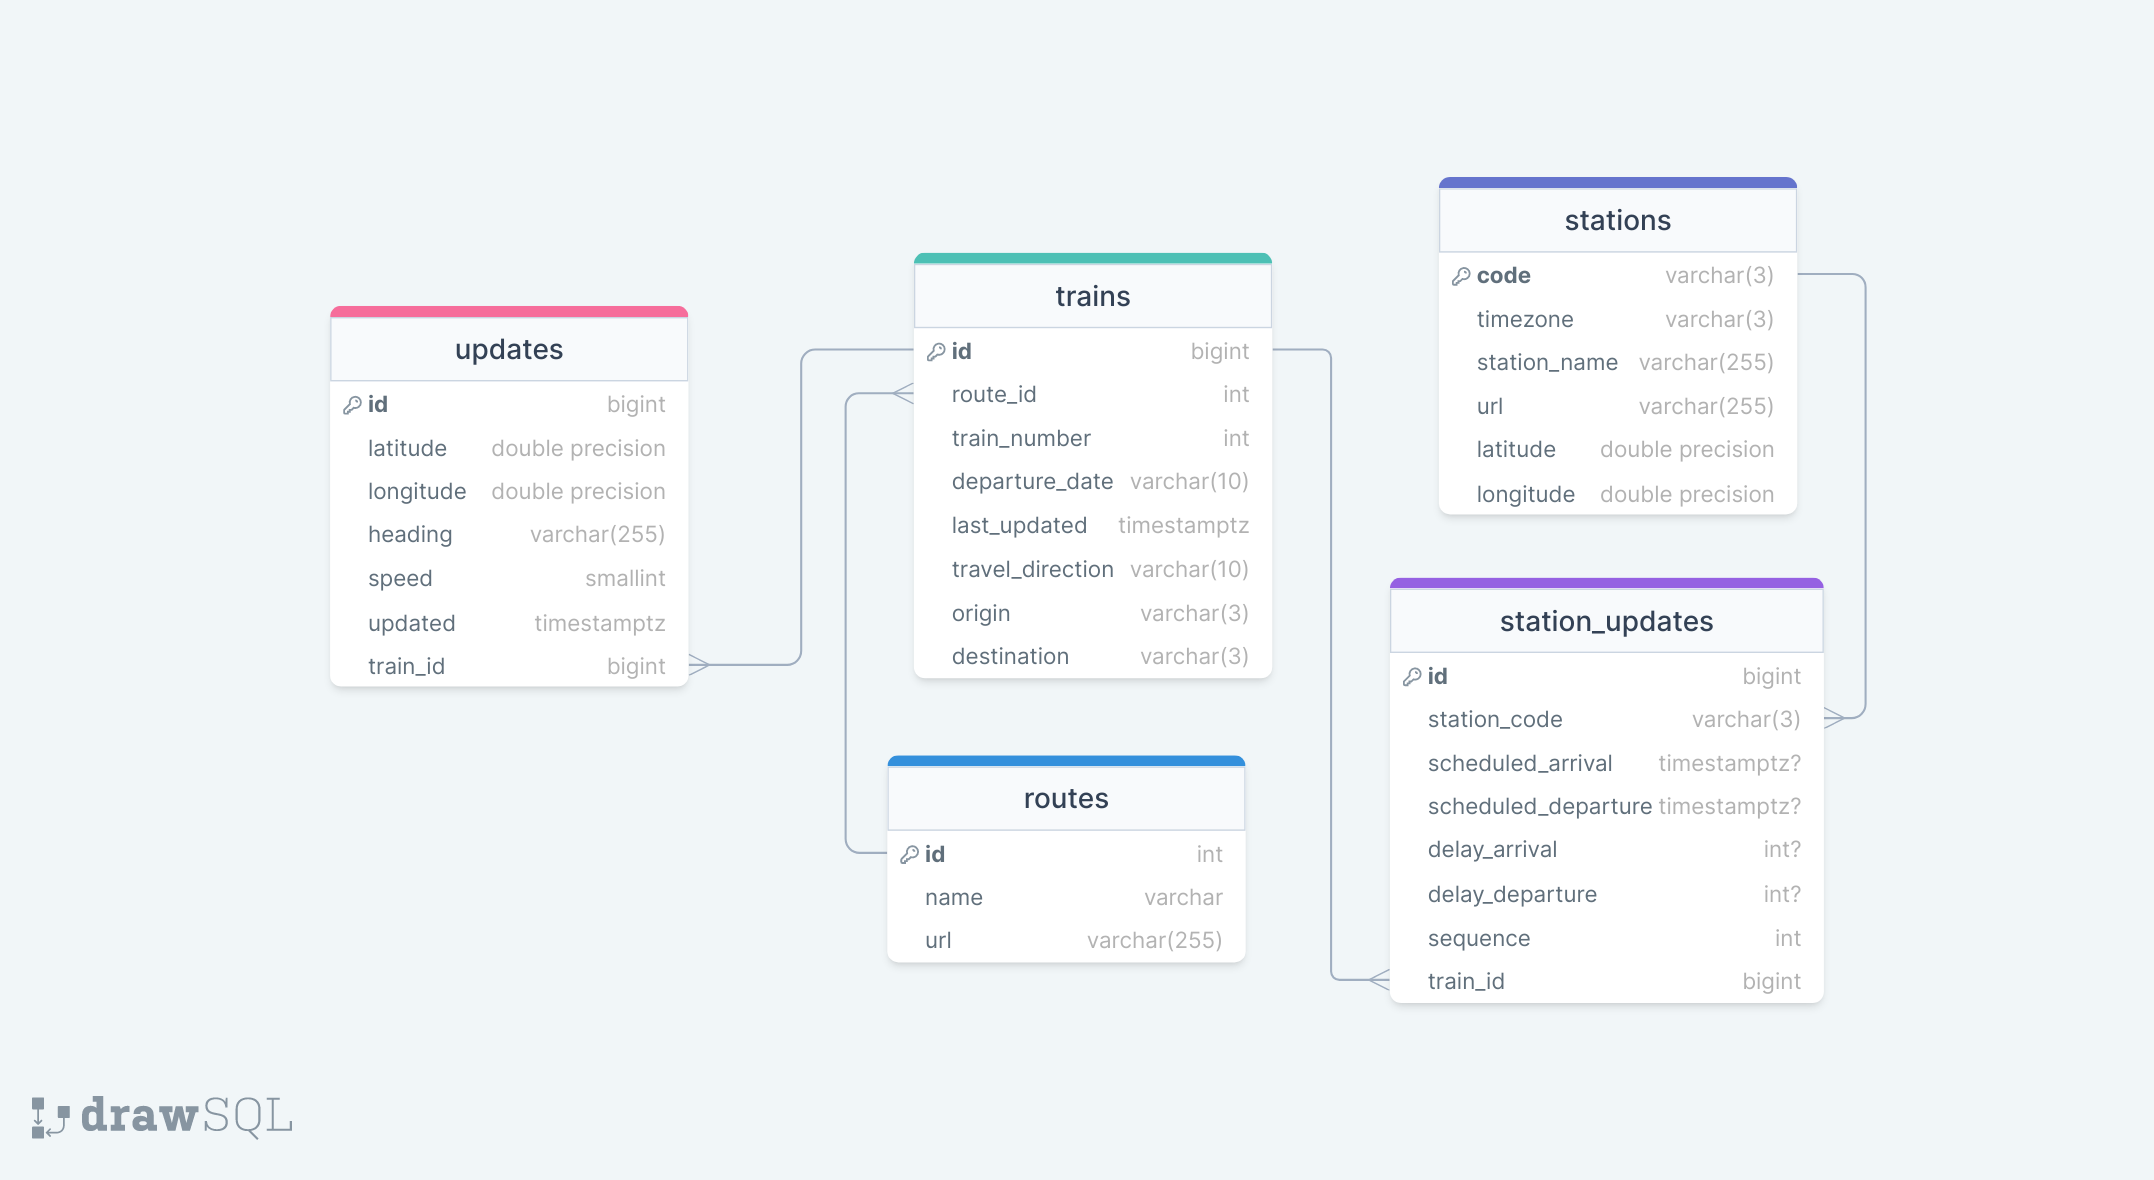
For the curious, the internal db is structured as so:

Future Ideas
The secondary “why” for this project was to build a potential platform for learning various data analysis and modeling techniques. Here are some ideas under consideration:
-
Performance Metrics: Provide performance metrics for each Amtrak station and route, including on-time performance percentages and average delay times.
-
Route Efficiency Analysis: Map train routes in speed segments and route timetable to calculate route efficiency. This could pinpoint bottlenecks where delays are frequent, and identify optimal track segments for speed improvement to improve trip times.
-
Historical Analysis: Collect a broader historical performance dataset to identify trends and seasonal variations in the Amtrak network.